From 80% Loss to 40% Profit: An AI-Powered Inventory Turnaround
Your inventory data holds secrets. We dove in with a Generative BI tool like Wren AI to uncover them. In minutes, we found a best-selling product that was actually a profit-killer, pinpointed the true source of our spoilage costs, and turned a money-losing promotion into a strategic tool to convert waste into profit. See the simple questions that unlocked thousands in savings.

Pin Chang
Updated: Nov 03, 2025
Published: Nov 03, 2025
Food waste isn't just bad for the planet; it's a direct hit to your bottom line. For years, the food industry has relied on gut feelings and messy spreadsheets to manage the delicate balance of inventory. Order too much, you're throwing away profits. Order too little, you face stockouts and unhappy customers. But what if you could replace guesswork with certainty? Generative BI tools like Wren AI are revolutionizing inventory management by allowing you to simply ask your data complex questions and get instant, intelligent answers.
The Bottleneck: Why Traditional Methods Fail
Let's be honest, the old way is broken. A manager at a busy grocery store or restaurant simply doesn't have time to:
- Manually cross-reference sales reports with purchasing invoices to calculate profit margins for 500 different products.
- Spend half a day filtering and pivoting tables to figure out why the "Seafood" category seems to be losing money.
- Wait a week for a data analyst to build a report on whether last month's "On Sale" promotion was actually profitable or just a revenue mirage.
By the time you get the insights, the opportunity is gone. This analytical delay is where profits go to die.
The Wren AI Revolution: From Data to Decision
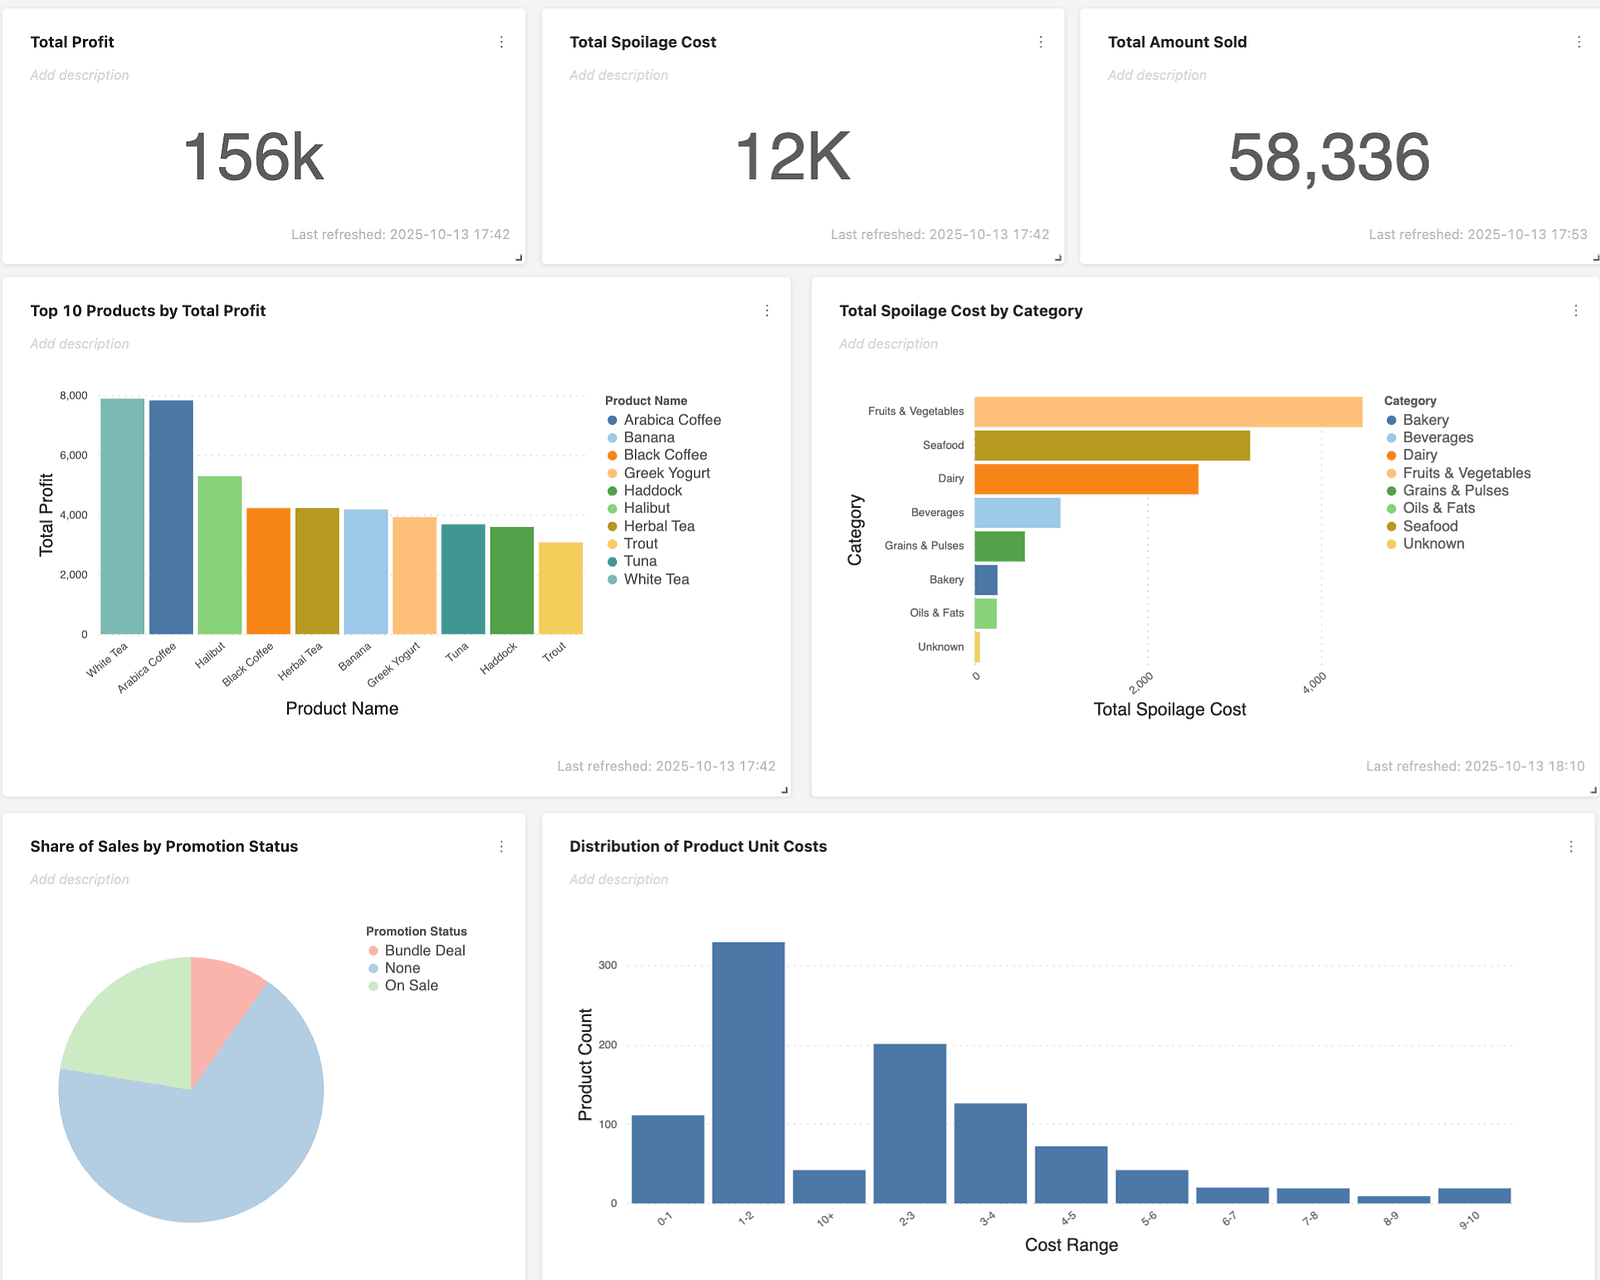 The Wren AI dashboard provides a clear, data-driven view of our inventory operations, highlighting several actionable insights:
- Key Profit Centers: Beverage and Seafood products are our primary profit drivers.
- Major Spoilage Areas: Perishables like Fruits & Vegetables, Seafood, and Dairy carry the highest financial risk.
- Promotional Performance: Current marketing campaigns appear to have limited success, indicating a need for strategic review and optimization.
- Inventory Structure: Our capital is tied up in low-cost goods, making efficient turnover essential.
Let's dive into a few scenarios to see how this changes everything.
Analysis 1: The Profitability Mirage - Who's Really Paying the Bills?
Revenue is a vanity metric; net profit is what matters. Calculating true profit means factoring in hidden costs like spoilage, a task where spreadsheets fail.
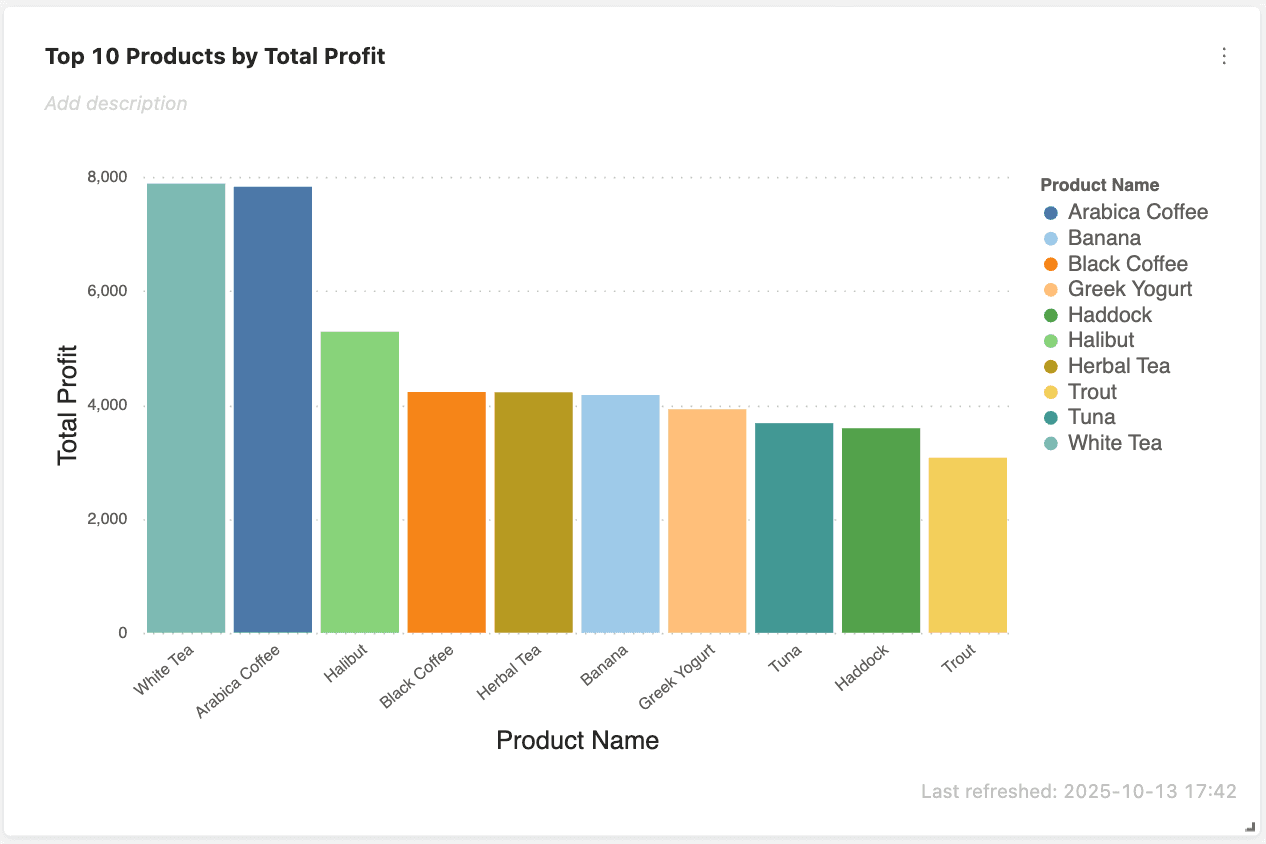 The Scenario: You're planning your weekly features. You know that from the dashboard White Tea is a top-seller by revenue. The obvious move is to promote it, right? First, we ask Wren AI a smarter question:
"Show me my top 10 products by net profit, and make sure to subtract spoilage costs."
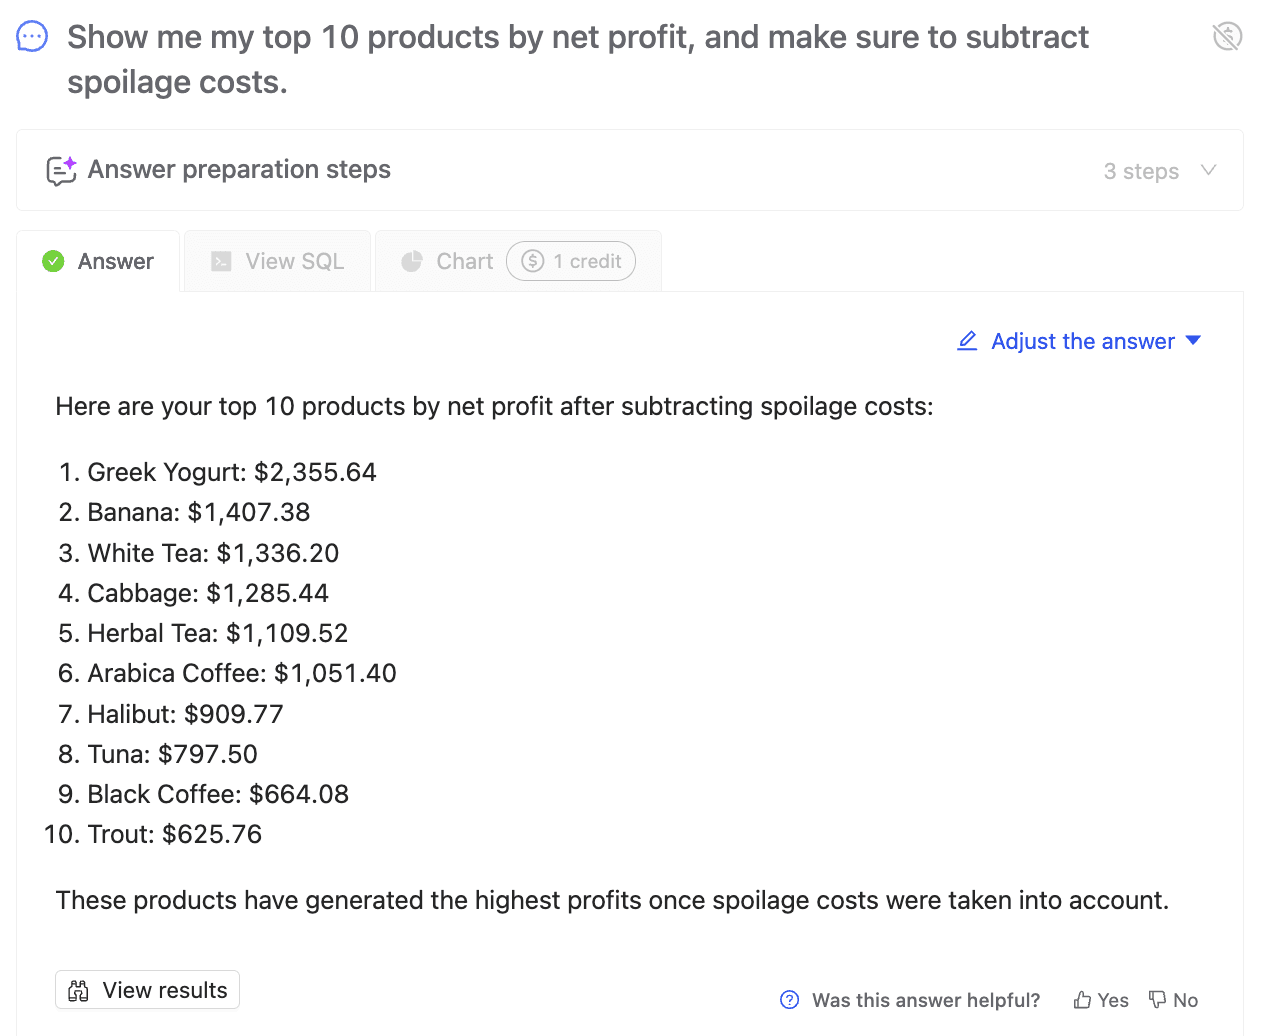 In seconds, Wren AI processes the numbers, connecting sales data with spoilage logs. The result is shocking.
The Insight & Improvement: The "star" product, White Tea, is a profit mirage. Its massive spoilage cost eats away nearly 80% of its earnings. In contrast, Greek Yogurt quietly stands out as the real hero with strong, stable net profits.
The Action 1: Instead of running another tea-themed promotion this season, you can plan to launch a "Healthy Dairy" campaign spotlighting Greek Yogurt and other dairy products. This not only sustains strong net profits but also minimizes the risk of spoilage.
The Action 2: At the same time, it's worth investigating the unexpected spike in spoilage for White Tea, Arabia Coffee, and other beverages, as something unusual might be happening behind the scenes. You may also want to reduce the restock volume for Seafood since it shows a high spoilage cost that could be quietly draining profits.
Analysis 2: The Spoilage Detective - Finding the Leak
You know spoilage is a problem, but where is the money really going? Is it a systemic issue or a few bad apples?
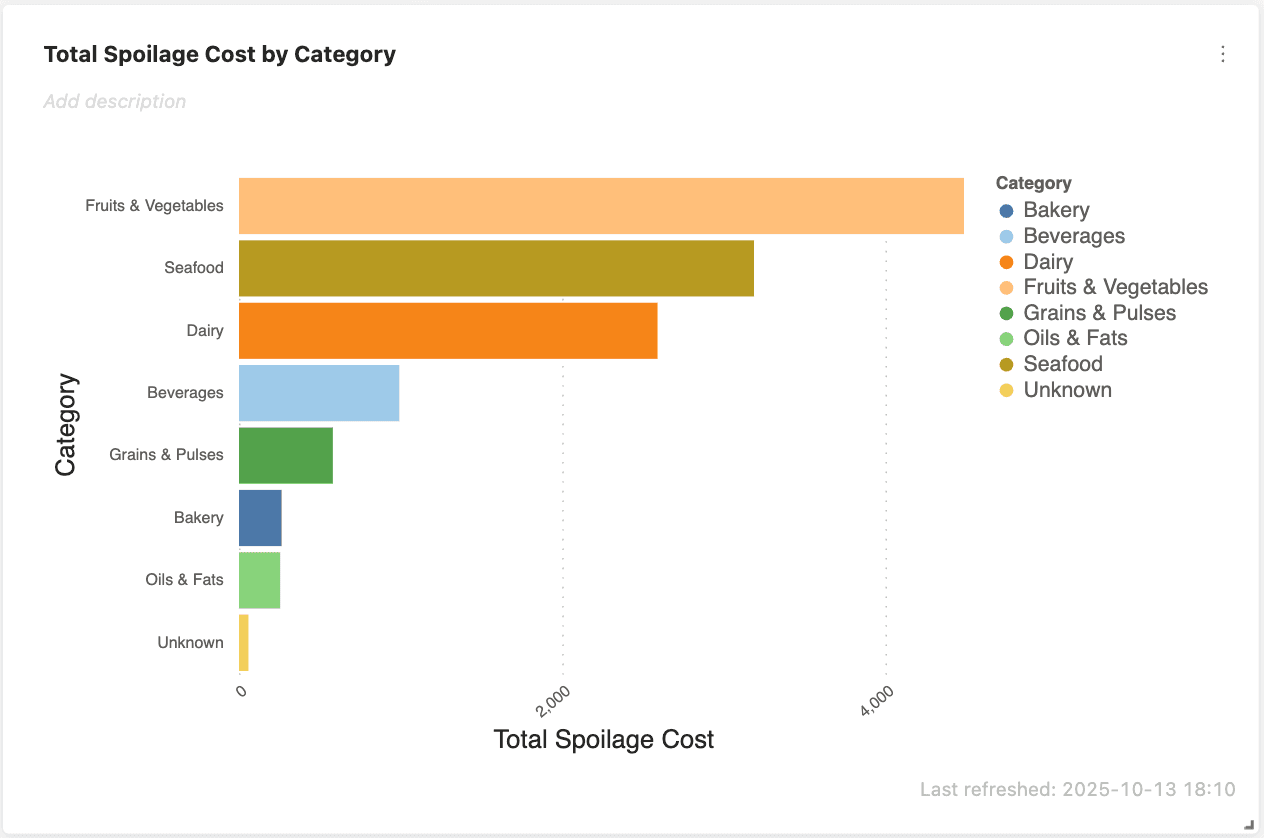 The Scenario: Your overall waste costs have risen by 15 percent this quarter, and it's time to uncover what's driving the increase before it escalates further. The dashboard points to the Fruit & Vegetable category as a key problem area.
"In the Fruit & Vegetable category, which 3 products have the highest spoilage cost?"
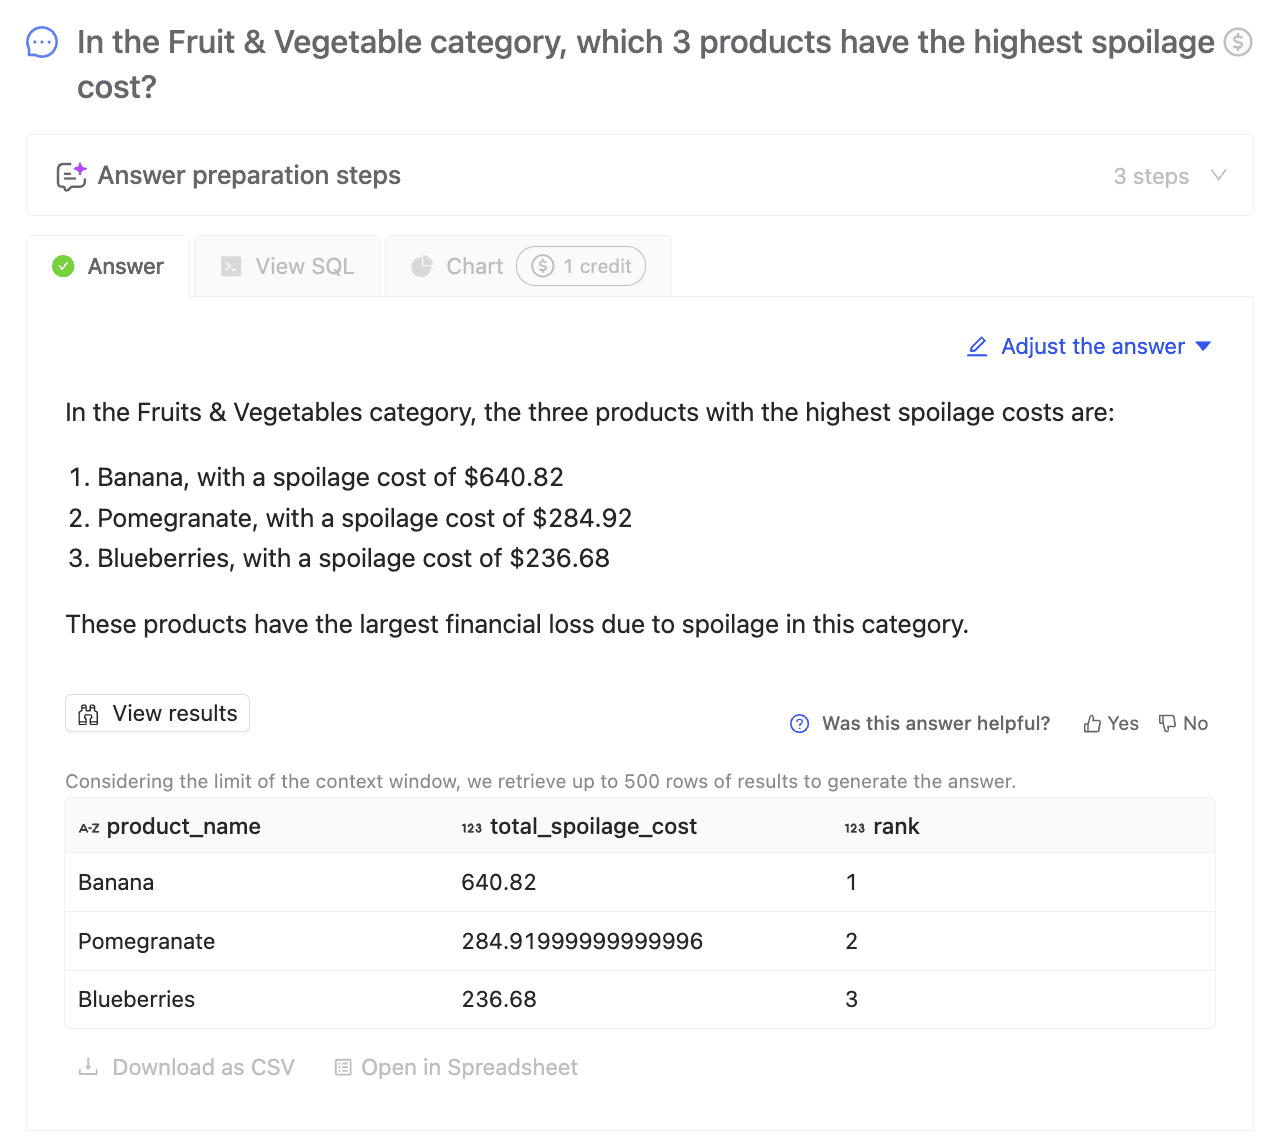
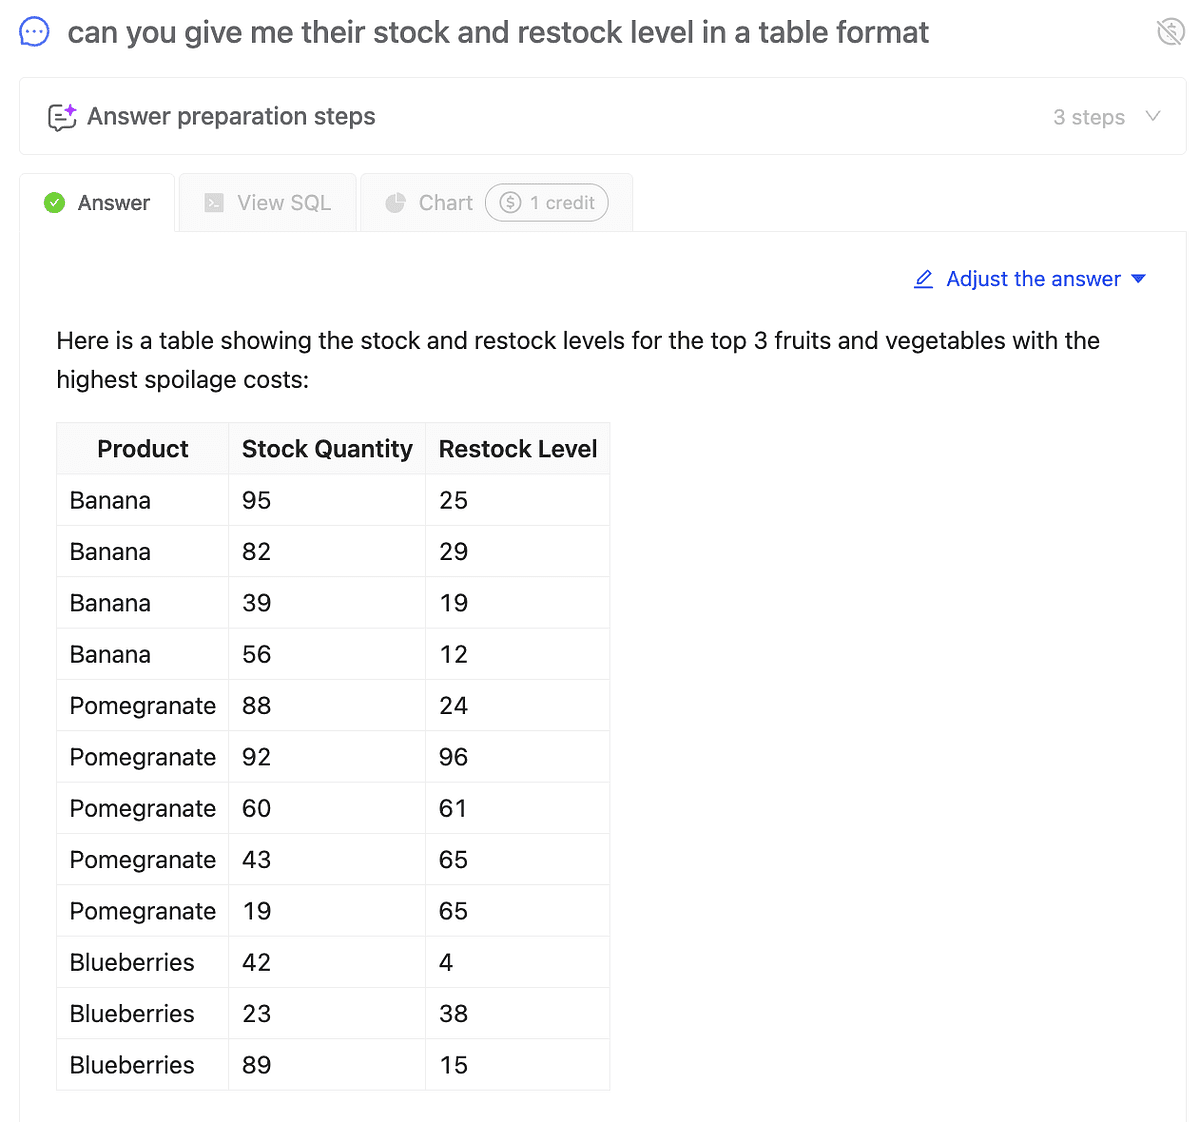 The Insight & Improvement: The issue is not only in the Fruit & Vegetable category but in how specific fruits are being ordered.
- Banana is being heavily overstocked. With a stock level of 95 and a reorder point of 25, you are carrying far too much inventory, which leads to unnecessary waste.
- Pomegranate shows the opposite pattern. In some locations, stock levels are below the reorder point, suggesting a sudden rise in demand. This often causes rushed and oversized restocks after a stockout, which then creates more spoilage.
The Action: Adjust the reorder levels and quantities for these items. Lower the reorder quantity for bananas to reduce excess inventory. For pomegranates, raise the reorder level in selected locations to trigger smaller and more consistent restocks, preventing the cycle of shortages and waste.
Analysis 3: The Promotion Paradox - Are Our Discounts Actually Costing Us Money?
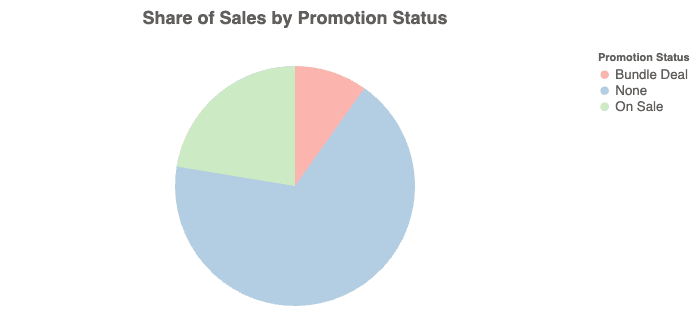 Promotions are a classic tool to boost sales. When we see an almost third of our sales volume coming from items marked "On Sale" and in a "Bundle Deal," it's easy to call it a success. But are we celebrating empty victories? Does that surge in volume come at the cost of our profitability?
The Scenario: The sales team wants to double down on "On Sale" promotions after seeing strong volume. You need to know if you're actually making money.
"Compare the average profit margin for each promotion status."
 The Insight & Improvement: This data reveals that our promotions are a strategic accelerator, not a margin killer. We maintain a healthy profit margin of around 40% across all promotion types. This means we have a powerful lever to pull for operational efficiency. The question is no longer "Can we afford a sale?" but "Where can we deploy a sale to solve a business problem?"
The most obvious application? Spoilage mitigation.
The Action: So, you ask Wren AI to identify the ticking time bombs in your inventory.
"Show me products in the 'Fruits & Vegetables' category with high spoilage quantity and an expiration date in the next 7 days."
This way you are not just minimizing a loss; you are transforming a potential loss into a gain. Yo can immediately implementing a new "Waste Watch" protocol. Using Wren AI, we'll identify perishable items nearing their expiration date and strategically deploy a margin-neutral "On Sale" or "Bundle Deal" to accelerate their sale. This transforms a potential 100% loss into a gain.
Analysis 4: The Strategic Matrix - What to Grow, What to Cut
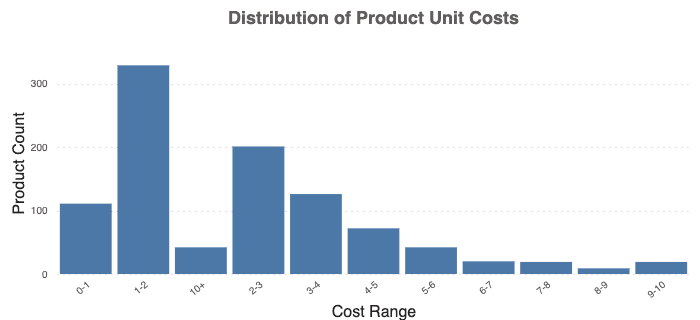 Finally, not all products are created equal. You need to know which are stars and which are just taking up space.
The Scenario: During your annual category review, you need to decide which products deserve more shelf space.
"Plot my products based on their inventory turnover and profit margin."
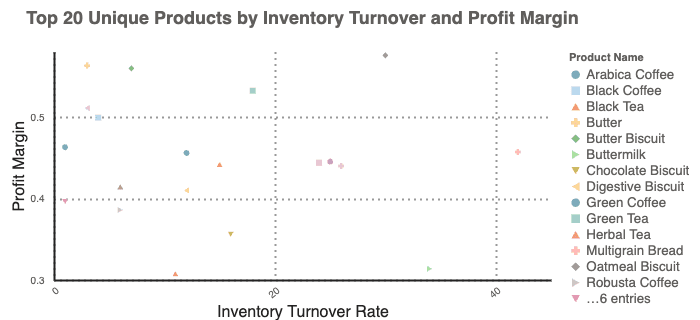 Wren AI generates a scatter plot, giving you an instant strategic framework:
- Stars (High Turnover, High Margin): Your champions. Protect and promote them.
- Workhorses (High Turnover, Low Margin): They are essential for driving traffic but aren't huge profit centers. Maintain competitive pricing and look for bundling opportunities. (e.g., "Taco Tuesday" kits that include low-margin onions with high-margin flank steak).
- Hidden Gems (Low Turnover, High Margin): Highly profitable niche items. Ensure they have good visibility but don't overstock.
- Problem Children (Low Turnover, Low Margin): Clear candidates for discontinuation to free up capital and shelf space.
The Future is Conversational In minutes, we've uncovered misleading top-sellers, diagnosed cost leaks, and built a data-driven strategy for our entire portfolio. Wren AI closes the gap between data and decision, turning inventory management from a chore into a competitive advantage. The food industry will always be a game of thin margins, but with tools like these, you're no longer guessing. You're having a conversation with your inventory and getting clear, intelligent answers back. Ready to transform how your organization accesses data? Request a demo or start your free trial at getwren.ai
Supercharge Your
Data with AI Today
Join thousands of data teams already using Wren AI to make data-driven decisions faster and more efficiently.
Start Free TrialRelated Posts
Related Posts

AI-Powered Business Intelligence: The Complete Guide to GenBI
Discover how Generative Business Intelligence (GenBI) powered by Wren AI is transforming data access with conversational AI, real-time insights, and intuitive decision-making tools for modern enterprises

Beyond Text-to-SQL: Why Feedback Loops and Memory Layers Are the Future of GenBI
How Wren AI’s Innovative Approach to Question-SQL Pairs and Contextual Instructions Delivers 10x More Accurate Generative Business Intelligence
Conversational BI Empowering Self-Service Analytics with Wren AI’s GenBI
Self-service analytics has reshaped business intelligence (BI) by enabling non-technical users — marketers, customer success managers, executives, and operations teams — to explore data independently, without relying on data experts.

